
If you are a WooCommerce store owner, you know that running a successful online business requires more than just creating a website and listing products. To truly thrive in e-commerce, you must deeply understand your customers, their behavior, and the factors contributing to your store’s success.
That is where analytics comes in. Analytics is collecting and analyzing data to gain insights into your business and make data-driven decisions. By leveraging analytics tools and techniques, you can measure your store’s performance, identify areas for improvement, and ultimately drive growth and revenue.
In this blog, we will explore how to use analytics to measure the success and growth of your WooCommerce store. We will cover everything from the key metrics you should measure to the tools and reports available in WooCommerce analytics.
So if you are ready to take the guesswork out of running a successful e-commerce business and start making data-driven decisions, let us dive in! But first, let’s take a look at how to export a report.
How to Export WooCommerce Analytics Report?
Automated data export from WooCommerce to Google Sheets can be done using various third-party tools and plugins available in the market. These tools automatically extract data from your WooCommerce store and transfer it to your Google Sheets account.
However, Google Sheets has built-in import tools to pull data from various sources, including WooCommerce. By setting up an import from WooCommerce to Google Sheets, you can ensure that your data is always up-to-date and easily accessible in a single location.
Connecting your WooCommerce store to Google Sheets for automated data export is easy! Go to the Admin Panel > WooCommerce > Google Sheet, and finally, the Integration screen. Enter the Access Code, which you can obtain by clicking the “Get Code” button. Once connected, you can automatically export your data to Google Sheets.
With this integration, you can keep your data up to date in real-time and quickly generate custom reports and dashboards. By automating this process, you can save time and effort and focus on making informed business decisions.
Some other popular tools that offer this integration include Zapier and WP Fusion, among others. You can choose the one that best suits your needs and budget!
The Key Elements in A WooCommerce Analytics Dashboard
One of the most valuable tools available to WooCommerce store owners is the WooCommerce Analytics dashboard. This dashboard provides an overview of your store’s performance and allows you to track critical metrics and KPIs in real-time.
The dashboard is typically divided into three main sections: Performance, Charts, and Leaderboards.
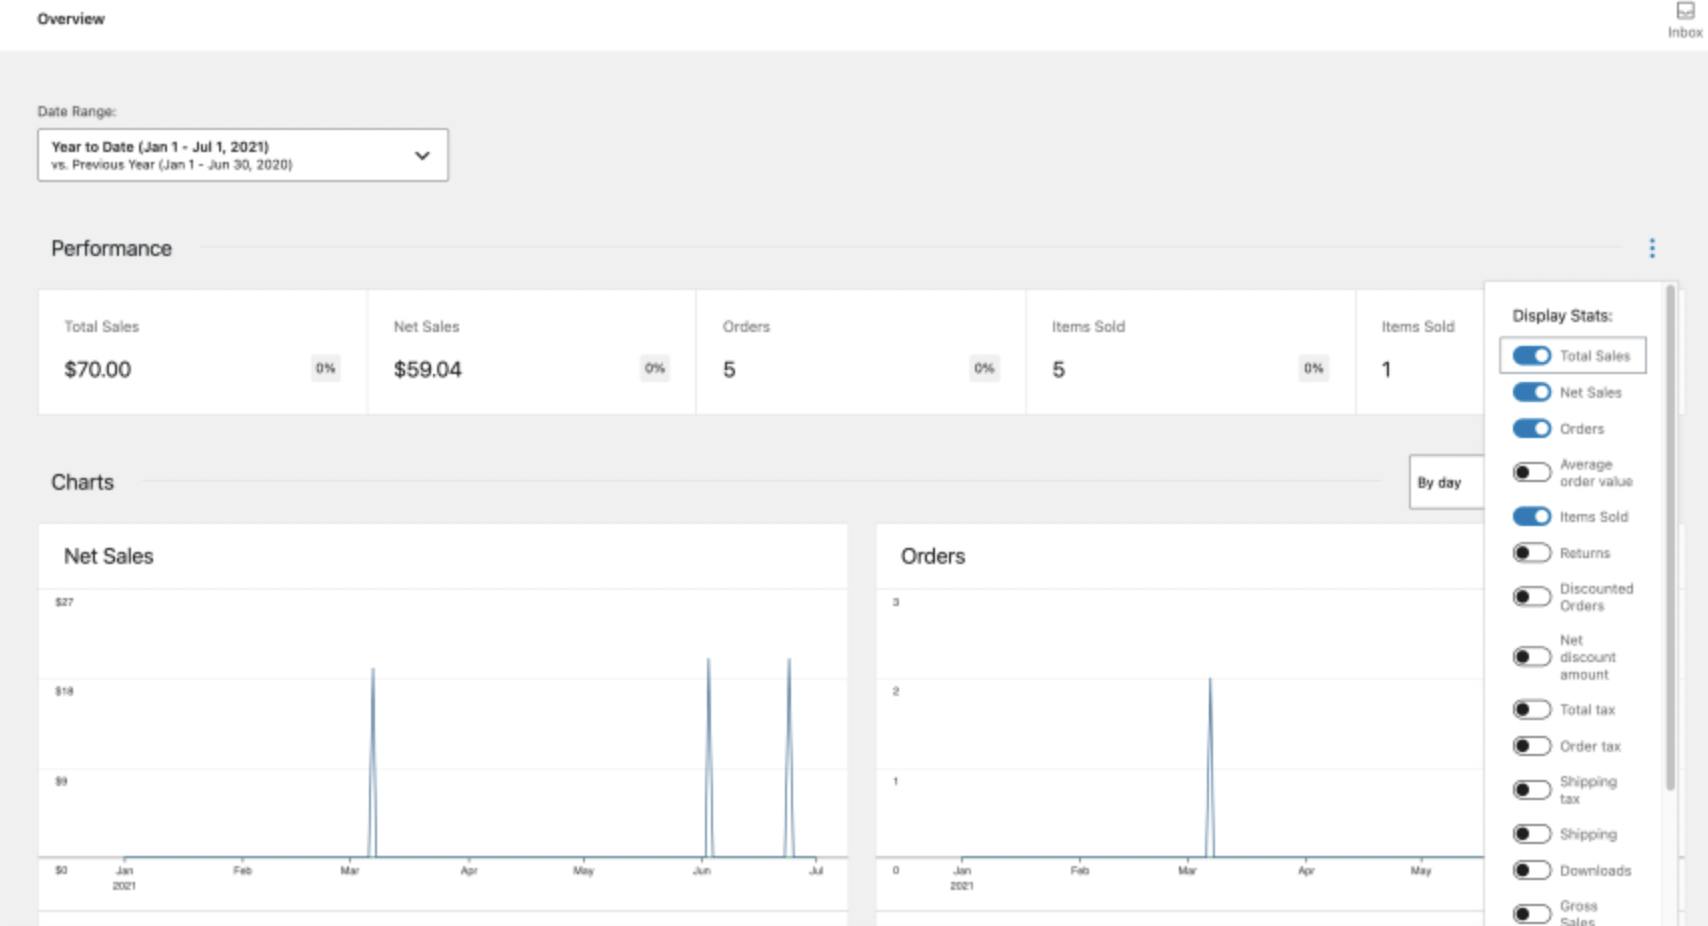
Performance
This section gives you a high-level overview of your store’s performance. It includes key metrics like total sales, average order value, gross sales, items sold, etc. You can set a date range to view performance over a specific period and compare performance to previous periods to identify trends.
You might have noticed these little percentage marks with either green or red colors on your store stats dashboard. These marks give you a quick indication of how your store is doing. You want to aim for the green effect, as it shows that your store is thriving and performing well. It is like a little pat on the back from WooCommerce telling you you are doing great! So, keep an eye on those green marks and strive to maintain them.
Charts
The Charts section provides visual representations of your store’s performance data. You can choose from various chart types, including line, bar, and pie charts. This section is handy for identifying patterns and trends in your data.
Leaderboards
The Leaderboards section allows you to compare the performance of different products, categories, and customers. You can view top-selling products, the highest revenue categories, and the most valuable customers. This section can help identify opportunities for growth and optimization.
WooCommerce Analytics: Key Metrics
Now that we have covered the basics of the WooCommerce Analytics dashboard let us dive into some key metrics you should monitor to improve your store’s performance.
Total Sales
WooCommerce Store Analytics provides a wealth of information that can help store owners make informed decisions to improve their business performance. The Total Sales report is one of the most critical metrics.
This report displays the store’s total sales revenue over a specified period. By analyzing this report, store owners can gain insights into their store’s overall performance, identify trends and patterns in sales, and make informed decisions about future strategies. It can also help you notice the effects of your campaigns and marketing efforts. For example, you can examine if there was an increase in sales after sending a specific email newsletter.
To make the most out of the Total Sales report, store owners should set a benchmark for their expected sales revenue based on historical data and industry standards. You can then compare your sales revenue to the bar to identify areas where you fall short or exceed expectations. For instance, if the Total Sales report shows a lower revenue than expected, store owners can analyze the information to identify potential issues such as low traffic, conversion rates, or average order value.
On the other hand, if the Total Sales report shows higher revenue than expected, store owners can analyze the information to identify which products or categories are driving the sales and determine ways to capitalize on that success. You can also use the report to identify trends in sales over time, such as peak sales periods or seasonal variations, and adjust your marketing and inventory strategies accordingly.
Gross Sales
Gross Sales are the total revenue generated from all orders placed on your WooCommerce store before deductions such as discounts or taxes. As a store owner, understanding your gross sales is vital for tracking overall performance and identifying areas for growth.
You can calculate your net profit by subtracting your cost of goods sold (COGS) and other expenses, such as shipping and payment processing fees. Therefore, you will clearly understand your profit margins, helping you make informed pricing and inventory management decisions.
Additionally, analyzing your gross sales can help you identify trends in customer behavior and popular products. You can use this information to optimize your marketing strategies and product offerings to meet customer demand better and drive more sales.
Another way to maximize gross sales is by implementing cross-selling and upselling strategies. You can increase the average order value by suggesting related products or offering upgrades during checkout, boosting your gross sales.
Average Order Value (AOV)
AOV is the average amount customers spend per order and is an important metric to measure the overall revenue potential of your WooCommerce store. Increasing AOV can drive more revenue for your store, and you can implement a few strategies.
- Offering product bundles or discounts for customers who purchase multiple items can increase the AOV.
- Offering free shipping for customers who spend a certain amount on your store can encourage customers to purchase additional items to meet the minimum spend threshold and increase the overall value of their order.
- Experimenting with cross-selling and upselling strategies can encourage customers to purchase additional products related to their original purchase. This can be done by suggesting related products during checkout or offering discounts for bulk purchases.
- Improving your website’s user experience can also help increase AOV. Provide accurate and compelling product descriptions and images, and offer detailed information on product features, benefits, and use cases to help customers make informed purchase decisions and increase the likelihood of higher AOV.
Returns
Returns are expected in e-commerce, and WooCommerce stores are no exception. A return happens when a customer returns a product for a refund or exchange, usually because the product was defective, not as described, or simply unwanted.
Returns can be a headache for WooCommerce store owners as they affect the bottom line and customer satisfaction. High return rates can indicate issues with product quality, shipping accuracy, or a need for better product descriptions and images.
One of the best ways to tackle returns is by leveraging analytics to predict and manage them. By analyzing historical data, WooCommerce store owners can identify trends and patterns to make informed decisions about their return policies.
For instance, analyzing data on returns can help store owners understand the most common reasons for returns, the products with the highest return rates, and the time customers take to request a return. This information allows store owners to optimize their return policies, improve product quality, and take proactive steps to reduce returns.
WooCommerce store owners can use various metrics to track returns, such as return rates, return reasons, return costs, and return times. These metrics can be used to identify the root cause of returns and make data-driven decisions to minimize their impact.
Discounted Orders
Discounted orders and net discounted amounts are essential metrics that can help businesses measure the success and growth of their WooCommerce store. These reports provide insight into customer behavior and the effectiveness of discount and coupon strategies.
Discounted orders represent the total number of orders with a discount or coupon code. This metric can indicate how many customers are taking advantage of discounts and can provide insight into the effectiveness of your promotional campaigns. On the other hand, the net discounted amount shows the total discounts applied to orders, which helps you understand the financial impact of deals on your business.
While discounts and coupons can be powerful tools for attracting customers and increasing sales, they must be used strategically. If you abuse discounts and offer them too frequently, customers may become conditioned only to buy products when they are on sale, which can hurt your profit margins in the long run.
The chart in WooCommerce analytics displays the number of discounted orders and the net discounted amount over a specific period. Analyzing this data allows you to determine and adjust your discount strategy’s effectiveness accordingly. For example, if you notice that the net discounted amount is too high, you may need to reduce the frequency or value of your discounts.
Useful WooCommerce Leaderboard Metrics
Using a leaderboard, you can find various metrics to help you identify the top-performing customers, products, categories, and coupons. Let us look at these metrics and how they can benefit your business.
Top Customers – Total Spend
WooCommerce Analytics provides store owners with valuable insights into the behavior of their customers, including their spending habits. The Top Customers – Total Spend leaderboard shows the customers who have spent the most money in your store. This information can be used to identify your most valuable customers and tailor your marketing efforts to retain them.
One way to make the most of this data is to create a loyalty program that rewards your top customers for their repeat business. You can offer exclusive discounts or perks, such as early access to new products or free shipping, to incentivize them to continue shopping with your store.
Additionally, you can use this data to personalize your marketing campaigns for these customers. For example, you can send targeted emails promoting products that align with their past purchases or offer them a unique discount code for their next purchase. By making these customers feel valued and appreciated, you can increase their lifetime value to your store.
Top Coupons – Number of Orders

The Top Coupons – Number of Orders section in WooCommerce Analytics Leaderboard provides store owners with valuable information about the effectiveness of their coupon strategies. By analyzing this data, store owners can determine which coupons are most effective at driving sales and increasing customer loyalty.
Using the stats, store owners can experiment with different types of coupons and discount strategies. For example, you can offer percentage-based discounts, flat-rate discounts, free shipping, or buy-one-get-one-free deals. By monitoring the number of orders associated with each coupon, you can determine which discounts appeal to your customers.
You can also use this data to identify which coupons are not driving the desired results. If a particular coupon is not generating a significant number of orders, it may be time to retire it or adjust the discount amount. On the other hand, if a coupon generates many orders, store owners can consider extending the offer or creating similar promotions in the future.
WooCommerce store owners can optimize coupon strategies and maximize sales by regularly reviewing the Top Coupons- Number of Orders data.
Top Categories – Items Sold

WooCommerce Analytics’ Top Categories – Items Sold report shows your store’s most popular product categories based on the number of items sold. By analyzing this report, store owners can gain insights into their customer’s buying habits and preferences.
You can use the data to optimize your product offerings and marketing strategies to make the most of this report. For example, if a specific category is consistently ranking high in the Top Categories report, consider expanding the product range in that category to cater to the demand. Alternatively, you can use targeted marketing campaigns to promote products in that category to increase sales further.
In addition, the Top Categories – Items Sold report can also help store owners identify underperforming categories that need attention. By analyzing why specific types are not also selling, store owners can change their product offering or marketing strategy to boost sales in those categories.
Top Products – Items Sold
In WooCommerce Analytics, looking at a Top Products – Items Sold report that lists the best-selling products in your store by the number of items sold is essential. This report can provide valuable insights into your customers’ buying habits and preferences. You can optimize your inventory management and marketing strategies by analyzing the data in this report.
Use this report to identify your top-performing products and use this information to focus your marketing efforts on those products. You can create targeted marketing campaigns or promotions to boost sales of these products even further. For example, you can offer bundle deals or discounts on related products to encourage customers to purchase more of your top-performing products.
Another way to use this report is to analyze the performance of individual products over time. By comparing data from different periods, you can identify trends and patterns in customer behavior. For example, you may notice that a particular product sells well during certain seasons or holidays. This information can help you plan your inventory and marketing strategies more effectively.
In addition, the Top Products – Items Sold report can also help you identify underperforming products. By analyzing the data, you may discover that some products have low sales and may not be worth keeping in your inventory. You can then decide whether to discontinue these products or invest in marketing efforts to improve their sales.
SEO WooCommerce Analytics
If you want to make sure your eCommerce content marketing strategy is effective, you must track SEO analytics, preferably using Google Analytics. This is essential for any WooCommerce store that wants to improve its search engine rankings and drive more traffic to its website.
Google Analytics is a free tool that provides valuable insights into your website’s performance, including how visitors are finding and interacting with your site. By tracking key performance indicators (KPIs), you can measure the success of your SEO efforts and make data-driven decisions to improve your website’s performance.
Some of the key KPIs that you should track using Google Analytics for your WooCommerce store include:
- Organic search traffic: This is the number of visitors who arrive at your website through a search engine, such as Google. By tracking organic search traffic, you can see how well your website is ranking for different search terms and identify opportunities to improve your SEO strategy.
- Bounce rate: This is the percentage of visitors who leave your website after viewing only one page. A high bounce rate can indicate that your website is not engaging visitors or providing the information they are looking for.
- Average session duration: This is the average amount of time that visitors spend on your website during a session. A longer average session duration can indicate that visitors are finding your website engaging and are spending more time exploring it.
- Conversion rate: This is the percentage of visitors who take a desired action on your website, such as making a purchase or filling out a form. By tracking your conversion rate, you can measure the effectiveness of your website’s design and content, as well as the success of your marketing and SEO efforts.
WooCommerce Analytics
Analytics is a powerful tool for measuring the success and growth of a WooCommerce store. By leveraging data on key performance indicators such as traffic, conversion rates, and revenue, store owners can gain valuable insights into their customers’ behavior and preferences, as well as identify areas for improvement. It is important to regularly review and analyze this data to make informed decisions and optimize the store’s performance. With the help of analytics, WooCommerce store owners can take their businesses to new heights and stay ahead of the competition.